How Mezmo Used Telemetry Pipeline to Handle Metrics
This is going to be the first of at least two posts about how we, in the Mezmo platform team, use Pipeline to handle metrics. It’s an ongoing effort and everything might change as we move forward and learn, but this is our plan and vision.
Current Condition

Sysdig is our primary metric store and visualization tool. It’s where we want our crucial metrics to go and where we do alerting and visualization. It’s our preferred tool for understanding the internals of our systems and mitigating problems as swiftly as possible.
Last year, a need for managing high cardinality metrics that aren’t as valuable emerged. Metrics often have tag information included along with the metric value. These tags can provide useful information for searching, defining views, and organizing metric values. However, too many unique tag values can result in poor performance and instability. High cardinality metrics refers to the case where metrics have a large number of non-unique tag values. Limiting the tag cardinality ensures that metrics storage and processing systems downstream are only retaining the most significant metrics.
To resolve this, we had to devise a new store for less important, high cardinality metrics. We also needed to start designing a pipeline architecture that incorporated the Tag Cardinality Limit Processor to identify the tags to process, and how to process them.
Prometheus is becoming a standard technology at this point, and standard is good if you work in platform. So, that’s what we installed to address that need. For various reasons, we ended up with multiple Prometheus installations and a few different ways to do things. This was, after all, for less critical metrics.
Which brings us to the current state of things: multiple metric stores, many ways to collect data, different processing being done, and no single pane of glass.
To my ears, “many ways to collect” and “processing” sound like the ideal problems for a Pipeline to solve and might even help us achieve a “single pane of glass” eventually. So that’s what we’ve set out to do!
Vision for the Future

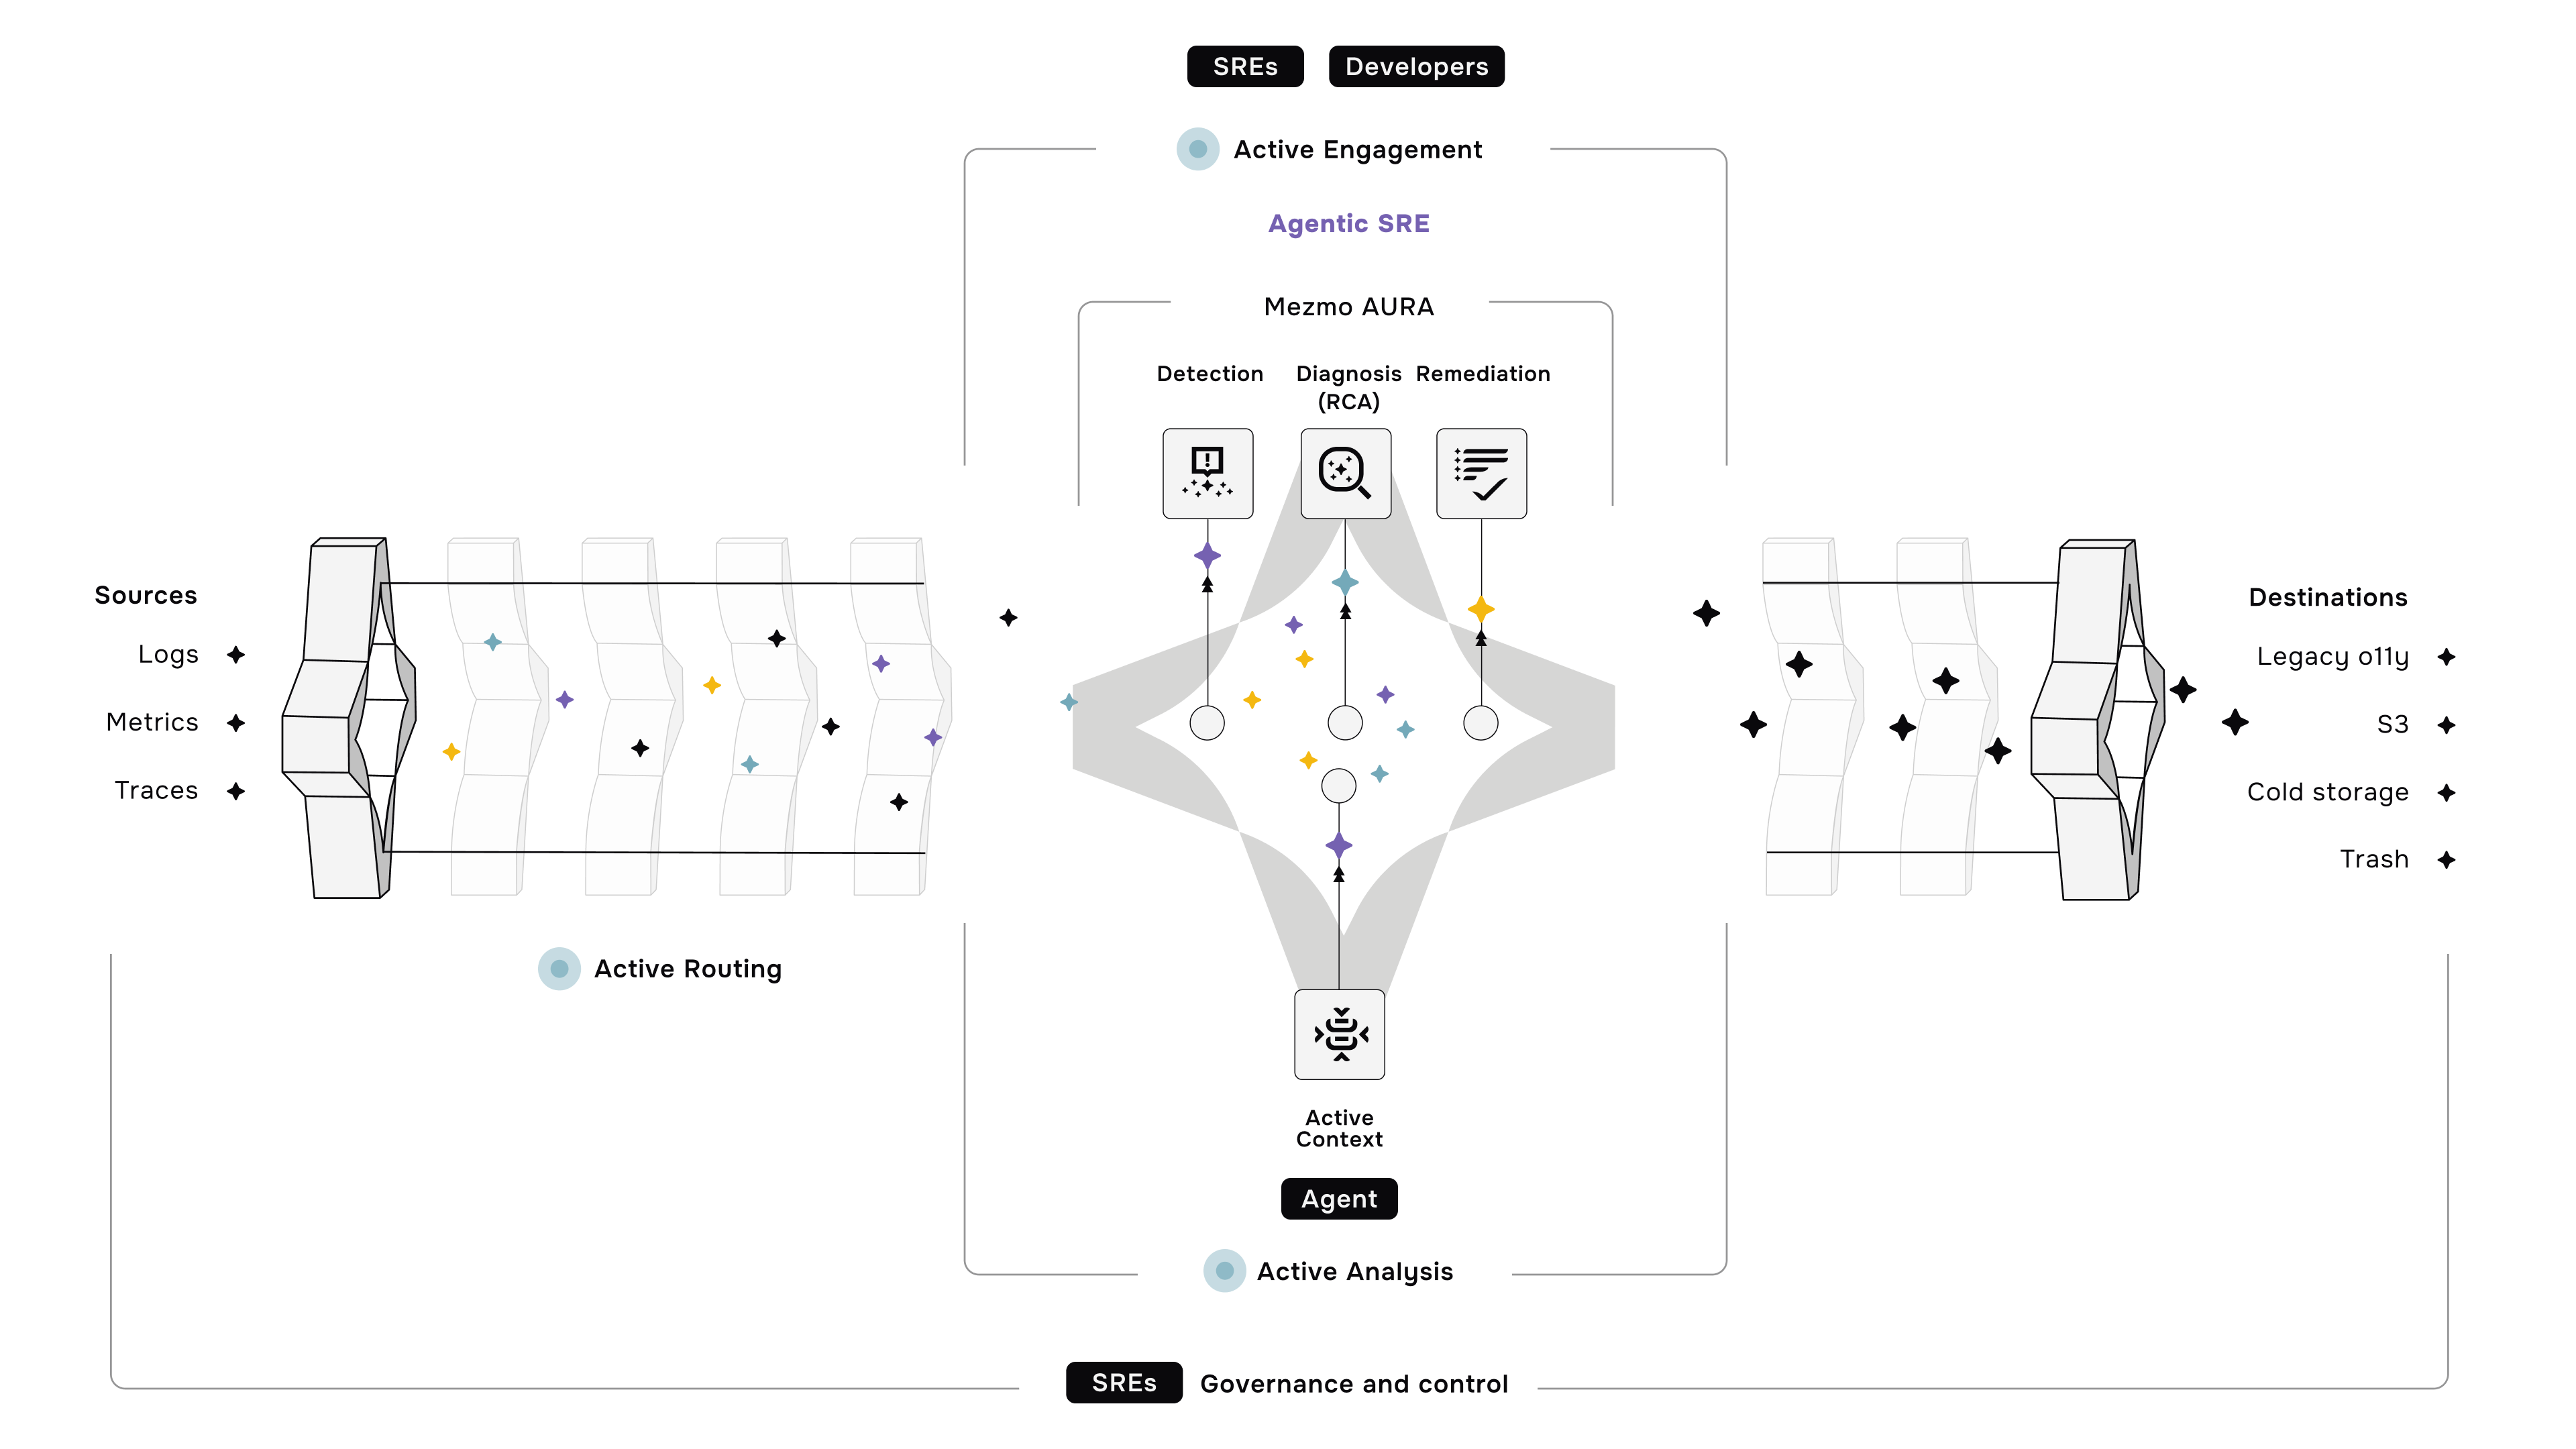
In the utopia of observability we have one backend where we can slice and dice our data quickly in any way we want to visualize and understand. But before we can reach that glorious future, we need to collect and transform our data in a way that allows us the flexibility to swap out and test new backends with ease until we find that utopian configuration. Here is our plan to get there:
First, we are switching from Sysdig Agent to the Otel Collector to collect metrics that our applications expose. We have to perform some basic transformations to add context – where the data is coming from, etc. – before sending it onwards to our Pipeline.
The role of our Pipeline here is to route and transform our metrics in an agnostic way so that changing the backend requires minimal effort while allowing us to stay in control of the cost that metrics can incur. This allows us to move fast and solve problems quickly, yay!
Transition Phase

For us to do all of this without disrupting the flow of metrics we rely on for our daily responsibilities, we need to bring up the new infrastructure while keeping the old in place.
The immediate role of our Pipeline is to 1) have a gate routing some metrics to Prometheus and others to Sysdig, ensuring that we don’t store the same information twice and 2) discard labels that we don’t need to reduce cardinality. And probably much more as we delve into it.
We will also migrate to a new central Prometheus so we don’t have to manage multiple installations. To start, we will replicate what we send to the existing Prometheus deployments, which includes: Elasticsearch per index, MongoDB, and Kafka metrics.
That’s the plan, let’s see how it unfolds. Stay tuned for updates on the progress we make!
Update: Part II is now up, read it now.
.jpg)






.png)





.png)


