Monitoring GitHub Activity with Mezmo

4 MIN READ
MIN READ

Source code management (SCM) is a core component of DevOps. In addition to storing and sharing source code, SCM tools maintain an ongoing history of changes. Reviewing this history provides numerous insights into your development process, including:

  • How often code changes are submitted
  • The impact of changes on application performance
  • Which changes result in errors, bugs, or broken builds

As development becomes an increasingly automated process, the ability to track and analyze logs as part of your telemetry pipeline becomes vital for observability and security. Monitoring logs from SCM and applications ensures that teams can identify problems early and correlate changes to their exact source. For example, if a particular change causes an entire deployment to fail, we need to know exactly which change it was and when it was integrated into our source code. This requires us to not only collect logs from the application, but also from the SCM tool.

With Mezmo, formerly known as LogDNA, you can monitor logs from GitHub the same way you monitor logs from your applications and infrastructure. Mezmo's GitHub integration lets you view events from your GitHub repositories—such as commits, branches, pull requests, and releases—in the Mezmo web app. You can then use Mezmo's full suite of tools to search, filter, and visualize your log data for in-depth analysis. By combining SCM event data with security logs and application telemetry pipelines, Mezmo provides a unified observability experience.

In this post, we'll explain how you can use GitHub integration to effectively monitor and analyze activities in your GitHub repository.

What GitHub Events can show up in Mezmo

Mezmo categorizes GitHub events into four different types, which you can enable or disable independently for each repository (except for core events):

  • Core events include basic repository actions such as pushing commits, submitting pull requests, creating releases, and forking.
  • Extended events include GitHub-specific actions such as starring a repository, organization and team actions, and creating a GitHub Pages site.
  • Issues events are generated whenever a GitHub Issue is created or modified.
  • Deployment events are generated by GitHub Deployments.

If an enabled action is performed in your repository, GitHub sends a Webhook containing the event’s details to Mezmo. The event appears in your log feed with “GitHub” as the source and your repository name as the App.

For example, we created a repository named “github-integration-test” and pushed a simple Python application to it. This created the following event in Mezmo containing the repository name (“github-integration-test”), affected branch (“master”), user (“logdna”), message (“Initial commit”), and list of modified files:

Next, let’s look at a few scenarios where this type of data would be useful.

Monitoring and Reviewing Code Activity

Mezmo records a continuous chronological stream of events for each repository where GitHub integration is enabled, helping you stay on top of changes to your applications. While this is also available in GitHub, Mezmo centralizes observability by connecting GitHub events, application logs, and security logs into a single telemetry pipeline.

For example, say you want to review changes made on a certain date. You could open your repository in GitHub and click through the commit history until you come across the correct date. You could also use git log and scroll to the correct date. Alternatively, you can open Mezmo, enter “app:<your repository name>” in the search box, and enter the exact date that you wish to search in the Timeframe box.

This lets you quickly and easily review changes, search through older commits, and monitor ongoing changes to source code.

Consolidating Application and Event Logs

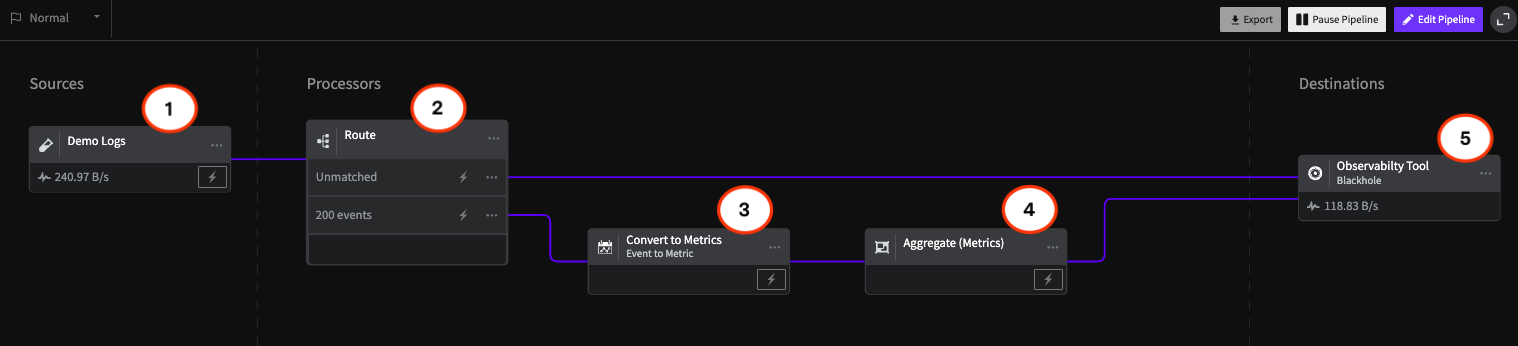
GitHub integration allows you to bridge events from your repository with logs from your application. By sending logs from both GitHub and your application to Mezmo, you can gain a complete view of your application from a single interface. This consolidated telemetry pipeline view provides enhanced visibility across your entire DevOps lifecycle, from SCM to production.

This is particularly useful for continuous integration and continuous delivery (CI/CD) pipelines, where code changes are often rapidly and automatically deployed into production.

For example, let’s create a new view specifically for logs relating to our application. An easy way to correlate application logs and GitHub logs is to tag our application logs with the same “app” name as our GitHub repository. This way, we can select the app name from the “All Apps” drop-down to show both types of logs.

In this example, we created a GitHub Issue to change the default hostname used by the Mezmo client to “logdna-node-1.” After pushing the changes and running the new app, we can immediately see the impact on our logs:

What Broke the Build?

Facebook popularized the phrase “move fast and break things,” which means bugs will be there and things will break. If a change results in a production error, we need to detect the error and the change that introduced it as quickly as possible.

For example, what if our latest change caused a new error message to appear in the logs? Previously, we’d need to manually match dates between our application logs and commit history to figure out which commit caused the problem. By combining application logs and GitHub events into a single view, you can correlate errors across multiple telemetry pipelines and siem tools for faster root cause analysis. This makes it easy to trace specific problems back to the latest commit for faster troubleshooting.

Conclusion

There’s much more to Mezmo's GitHub integration than the use cases we covered in this blog. In addition to tracking commits and issues, GitHub integration lets you log deployment events, releases, forks, pull requests, organization and team events, and even events surrounding GitHub Pages sites.

To get started, log into your Mezmo account and navigate to the Integrations page under Settings. To learn more about GitHub integration, visit the documentation page on version control systems.

By leveraging telemetry pipelines and siem tools together, you can transform your SCM activity into a complete observability and security framework. If you're not currently consolidating your GitHub and application logs, get started for free with Mezmo or contact us to learn more.


Table of Contents

    Share Article

    RSS Feed

    Next blog post
    You're viewing our latest blog post.
    Previous blog post
    You're viewing our oldest blog post.
    Mezmo + Catchpoint deliver observability SREs can rely on
    Mezmo’s AI-powered Site Reliability Engineering (SRE) agent for Root Cause Analysis (RCA)
    What is Active Telemetry
    Launching an agentic SRE for root cause analysis
    Paving the way for a new era: Mezmo's Active Telemetry
    The Answer to SRE Agent Failures: Context Engineering
    Empowering an MCP server with a telemetry pipeline
    The Debugging Bottleneck: A Manual Log-Sifting Expedition
    The Smartest Member of Your Developer Ecosystem: Introducing the Mezmo MCP Server
    Your New AI Assistant for a Smarter Workflow
    The Observability Problem Isn't Data Volume Anymore—It's Context
    Beyond the Pipeline: Data Isn't Oil, It's Power.
    The Platform Engineer's Playbook: Mastering OpenTelemetry & Compliance with Mezmo and Dynatrace
    From Alert to Answer in Seconds: Accelerating Incident Response in Dynatrace
    Taming Your Dynatrace Bill: How to Cut Observability Costs, Not Visibility
    Architecting for Value: A Playbook for Sustainable Observability
    How to Cut Observability Costs with Synthetic Monitoring and Responsive Pipelines
    Unlock Deeper Insights: Introducing GitLab Event Integration with Mezmo
    Introducing the New Mezmo Product Homepage
    The Inconvenient Truth About AI Ethics in Observability
    Observability's Moneyball Moment: How AI Is Changing the Game (Not Ending It)
    Do you Grok It?
    Top Five Reasons Telemetry Pipelines Should Be on Every Engineer’s Radar
    Is It a Cup or a Pot? Helping You Pinpoint the Problem—and Sleep Through the Night
    Smarter Telemetry Pipelines: The Key to Cutting Datadog Costs and Observability Chaos
    Why Datadog Falls Short for Log Management and What to Do Instead
    Telemetry for Modern Apps: Reducing MTTR with Smarter Signals
    Transforming Observability: Simpler, Smarter, and More Affordable Data Control
    Datadog: The Good, The Bad, The Costly
    Mezmo Recognized with 25 G2 Awards for Spring 2025
    Reducing Telemetry Toil with Rapid Pipelining
    Cut Costs, Not Insights:   A Practical Guide to Telemetry Data Optimization
    Webinar Recap: Telemetry Pipeline 101
    Petabyte Scale, Gigabyte Costs: Mezmo’s Evolution from ElasticSearch to Quickwit
    2024 Recap - Highlights of Mezmo’s product enhancements
    My Favorite Observability and DevOps Articles of 2024
    AWS re:Invent ‘24: Generative AI Observability, Platform Engineering, and 99.9995% Availability
    From Gartner IOCS 2024 Conference: AI, Observability Data, and Telemetry Pipelines
    Our team’s learnings from Kubecon: Use Exemplars, Configuring OTel, and OTTL cookbook
    How Mezmo Uses a Telemetry Pipeline to Handle Metrics, Part II
    Webinar Recap: 2024 DORA Report: Accelerate State of DevOps
    Kubecon ‘24 recap: Patent Trolls, OTel Lessons at Scale, and Principle Platform Abstractions
    Announcing Mezmo Flow: Build a Telemetry Pipeline in 15 minutes
    Key Takeaways from the 2024 DORA Report
    Webinar Recap | Telemetry Data Management: Tales from the Trenches
    What are SLOs/SLIs/SLAs?
    Webinar Recap | Next Gen Log Management: Maximize Log Value with Telemetry Pipelines
    Creating In-Stream Alerts for Telemetry Data
    Creating Re-Usable Components for Telemetry Pipelines
    Optimizing Data for Service Management Objective Monitoring
    More Value From Your Logs: Next Generation Log Management from Mezmo
    A Day in the Life of a Mezmo SRE
    Webinar Recap: Applying a Data Engineering Approach to Telemetry Data
    Dogfooding at Mezmo: How we used telemetry pipeline to reduce data volume
    Unlocking Business Insights with Telemetry Pipelines
    Why Your Telemetry (Observability) Pipelines Need to be Responsive
    How Data Profiling Can Reduce Burnout
    Data Optimization Technique: Route Data to Specialized Processing Chains
    Data Privacy Takeaways from Gartner Security & Risk Summit
    Mastering Telemetry Pipelines: Driving Compliance and Data Optimization
    A Recap of Gartner Security and Risk Summit: GenAI, Augmented Cybersecurity, Burnout
    Why Telemetry Pipelines Should Be A Part Of Your Compliance Strategy
    Pipeline Module: Event to Metric
    Telemetry Data Compliance Module
    OpenTelemetry: The Key To Unified Telemetry Data
    Data optimization technique: convert events to metrics
    What’s New With Mezmo: In-stream Alerting
    How Mezmo Used Telemetry Pipeline to Handle Metrics
    Webinar Recap: Mastering Telemetry Pipelines - A DevOps Lifecycle Approach to Data Management
    Open-source Telemetry Pipelines: An Overview
    SRECon Recap: Product Reliability, Burn Out, and more
    Webinar Recap: How to Manage Telemetry Data with Confidence
    Webinar Recap: Myths and Realities in Telemetry Data Handling
    Using Vector to Build a Telemetry Pipeline Solution
    Managing Telemetry Data Overflow in Kubernetes with Resource Quotas and Limits
    How To Optimize Telemetry Pipelines For Better Observability and Security
    Gartner IOCS Conference Recap: Monitoring and Observing Environments with Telemetry Pipelines
    AWS re:Invent 2023 highlights: Observability at Stripe, Capital One, and McDonald’s
    Webinar Recap: Best Practices for Observability Pipelines
    Introducing Responsive Pipelines from Mezmo
    My First KubeCon - Tales of the K8’s community, DE&I, sustainability, and OTel
    Modernize Telemetry Pipeline Management with Mezmo Pipeline as Code
    How To Profile and Optimize Telemetry Data: A Deep Dive
    Kubernetes Telemetry Data Optimization in Five Steps with Mezmo
    Introducing Mezmo Edge: A Secure Approach To Telemetry Data
    Understand Kubernetes Telemetry Data Immediately With Mezmo’s Welcome Pipeline
    Unearthing Gold: Deriving Metrics from Logs with Mezmo Telemetry Pipeline
    Webinar Recap: The Single Pane of Glass Myth
    Empower Observability Engineers: Enhance Engineering With Mezmo
    Webinar Recap: How to Get More Out of Your Log Data
    Unraveling the Log Data Explosion: New Market Research Shows Trends and Challenges
    Webinar Recap: Unlocking the Full Value of Telemetry Data
    Data-Driven Decision Making: Leveraging Metrics and Logs-to-Metrics Processors
    How To Configure The Mezmo Telemetry Pipeline
    Supercharge Elasticsearch Observability With Telemetry Pipelines
    Enhancing Grafana Observability With Telemetry Pipelines
    Optimizing Your Splunk Experience with Telemetry Pipelines
    Webinar Recap: Unlocking Business Performance with Telemetry Data
    Enhancing Datadog Observability with Telemetry Pipelines
    Transforming Your Data With Telemetry Pipelines