Enhancing Grafana Observability With Telemetry Pipelines
Grafana stands out when we think of visualizing and analyzing data across a multitude of sources. Its interactive dashboards packed with graphs, tables, and alerts, paint a live portrait of data. However, Grafana can do little to help observability when the incoming data is almost entirely noise.
Telemetry pipelines, which focus on optimizing and refining data before it reaches visualization tools, are crucial in this context. A telemetry pipeline pre-processes that data to help make Grafana far more effective.
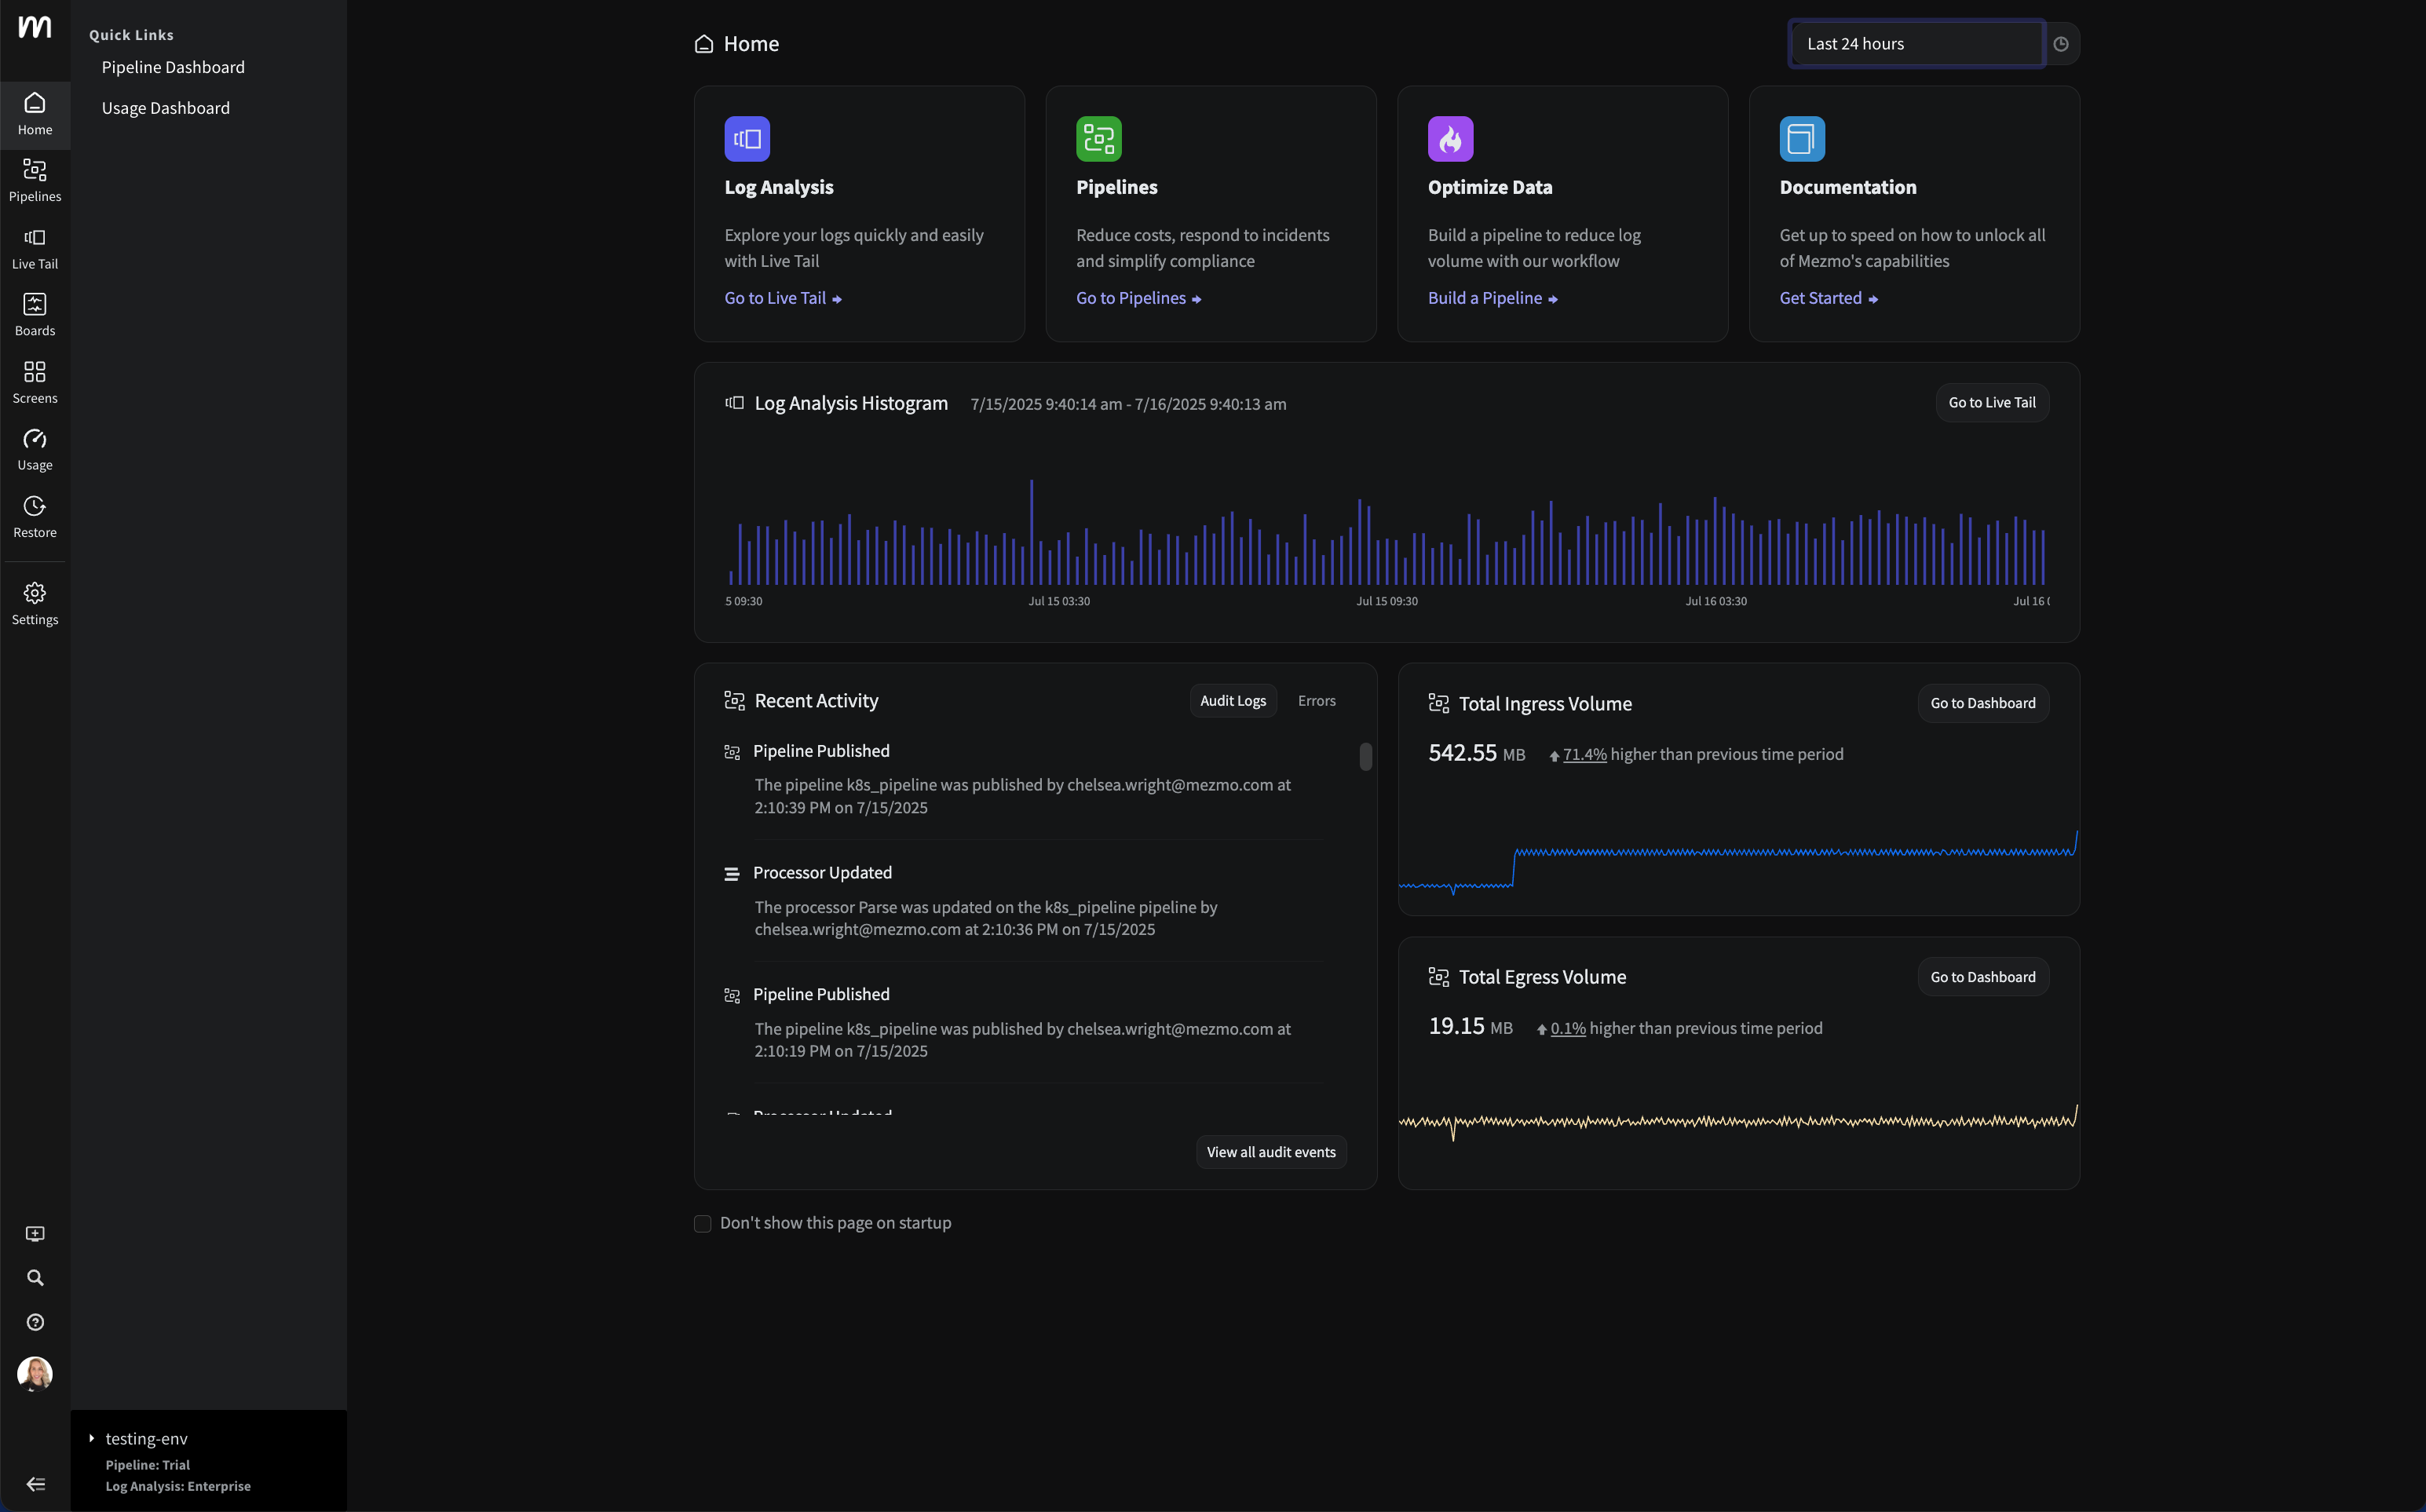
Mezmo's Telemetry Pipeline serves as a fantastic example, exemplifying how to supercharge Grafana’s capabilities by facilitating advanced data management.
The Role of Telemetry Pipelines in Achieving Observability Best Practices
The world of observability thrives on high-quality, precise data. Telemetry pipelines play a pivotal role in this, refining and shaping raw data to extract maximum value. Let’s examine the fundamental practices that any good telemetry pipeline should encompass, with insights drawn from Mezmo’s approach:
- Noise Filtering: Amidst the vast influx of data, telemetry pipelines, like Mezmo, effectively filter out the noise, spotlighting only what’s truly essential.
- Long-Term Data Retention: Retaining historical data isn’t only about storage, but accessing trends over time. Telemetry pipelines ensure data longevity, with Mezmo allowing Grafana to tap into rich historical perspectives for analysis.
- Event Trimming: Optimized analytics require refined data. Telemetry pipelines are designed to trim events to their most insightful form, much like how Mezmo provides Grafana with the most relevant and useful data.
- Data Condensation: With telemetry pipelines, vast logs are processed and condensed into focused metrics. Mezmo’s pipeline is exemplary in this, ensuring Grafana receives only the most relevant data slices.
- Operational Efficiency Boosting: Backend operations, when supported by effective telemetry pipelines, experience increased speed and reliability. Mezmo, in this context, enhances the very backbone that Grafana relies on.

Optimizing Grafana Observability: Best Practices
When one taps into the potential of Grafana, it becomes clear that mere data visualization is just the tip of the iceberg. To leverage its full power, here are some core best practices to consider:
Use the Right Data Sources
Accuracy and reliability are paramount. Grafana’s compatability with a diverse range of data sources– from databases like MySQL, PostgreSQL, and InfluxDB to cloud services like Amazon CloudWatch and Google Cloud Monitoring – ensures you’re not limited in choice. For those monitoring cloud services, a cloud-centric data source is recommended.
Telemetry pipelines, such as the Mezmo Telemetry Pipeline, refine and direct these varied data sources, enabling Grafana to present them seamlessly.

Leverage Plugins
Grafana’s extensive library of plugins can significantly extend its functionality and expand its horizon. These plugins include new visualizations, data sources, and alerting mechanisms. Noteworthy plugins include Prometheus, ElasticSearch, and Graphite.
Customizing Grafana with the right plugin ensures that your telemetry data is effectively represented.
Customize Dashboards
Tailoring dashboards to suit specific needs enhances the visualization experience. Grafana’s flexibility in adding panels, customizing layouts, and introducing dynamic variables facilitates a comprehensive analysis of telemetry data.
Set Up Alerts
Staying proactive is key. With Grafana, you can establish alerts on metrics, logs, or events. Such preemptive measures, like being notified when a server’s CPU usage spikes, ensure you’re always one step ahead.
Telemetry pipelines amplify Grafana’s alerting capabilities, broadening the range and functionality of the alerts.
Harness the Power of Annotations
Contextualizing metrics through annotations provides depth to data visualization. Marking significant events or documenting metrics offers a holistic view to your team.
Efficient telemetry pipelines can integrate critical annotations into Grafana, adding layers of meaning to the visualized data.
Share and Collaborate
Grafana’s sharability feature bridges communication gaps. Sharing dashboards (either via URLs or by embedding them) fosters collaboration.
The data channeled through telemetry pipelines adds a layer of comprehensive information beneficial for the entire team.
Mezmo: The Missing Spark for Grafana Insights
Embracing telemetry pipelines is the next step in redefining your monitoring landscape. While they fundamentally reshape data visualization, using tools like Mezmo can particularly amplify Grafana’s capabilities. From in-depth analysis, real-time data representation, to robust automation, the blend of an effective telemetry pipeline and Grafana can truly be transformative.
By integrating advanced telemetry pipelines, such as Mezmo, with Grafana, organizations can venture into a new paradigm of data-driven decision-making and system optimization.
Start a free trial of Mezmo Telemetry Pipeline to experience the true synergy of Grafana and advanced telemetry.
.jpg)





.png)




.png)


