RELATED ARTICLES
SHARE ARTICLE
Using Mezmo Templates for NGINX, Heroku, and More
Learning Objectives
• Learn how to use Mezmo's Template Library to get up and running with NGINX, Heroku, and Windows quickly, as well as the Browser Logger and Web Server Templates for frontend developers
Using Mezmo Templates for NGINX, Heroku, and More
Mezmo, formerly known as LogDNA, continuously innovates in log management solutions to improve and grow the developer ecosystem through streamlined usability. Mezmo can efficiently index, analyze, and aggregate log data across different sources such as cloud systems, orchestration platforms, bare-metal servers, and applications. It is designed for various use cases and works with any infrastructure, architecture, or language to support logging at scale.
One of Mezmo major out-of-the-box offerings is its Template Library, which helps users manage their log data at every level of their stack. The templates help set baseline log data without manually creating views, boards, and screens, making log access and insight management much quicker.
This tutorial will show you how to use Mezmo's Template Library to get up and running with NGINX, Heroku, and Windows quickly, as well as the Browser Logger and Web Server Templates for frontend developers. It will concentrate on the information that each of these templates highlights and why that information is valuable to developers, SREs, and DevOps teams.
So, how do you get started with Mezmo?
- Create an account here (Mezmo offers a free trial account)
- After creating your account, log in and add a log source to Mezmo
- Now, log in to the Web app and start viewing your logs!

NGINX Ingress Controller Template for Improved Log Analytics
The Mezmo NGINX Ingress Controller Template gives users better visibility into their infrastructure thanks to pre-configured views, boards, and screens for the NGINX Ingress Controller for Kubernetes (nginxinc/Kubernetes-ingress) logs. These customized dashboards and graphs can help you quickly put LogDNA’s visibility tools to good use. NGINX Ingress Controller is available in both open-source and commercial versions, and it serves as the foundation for Kubernetes's default "community'' ingress controller.
To begin setting up the NGINX Ingress Controller Template, you first need to create an account for your organization with Mezmo. You can start with a free trial account. Then, you’ll need to log in to add a log source to Mezmo.
Configuring the NGINX Template
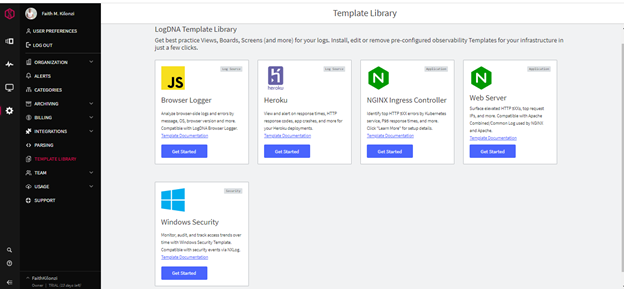
To configure the NGINX Ingress Controller Template, navigate to the dashboard, select Templates, and choose NGINX from the list:

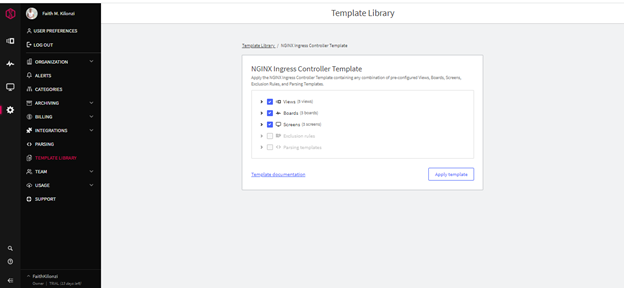
Next, choose the NGINX Ingress Controller Template from the list of Mezmo Template Libraries, then click the Get Started button:

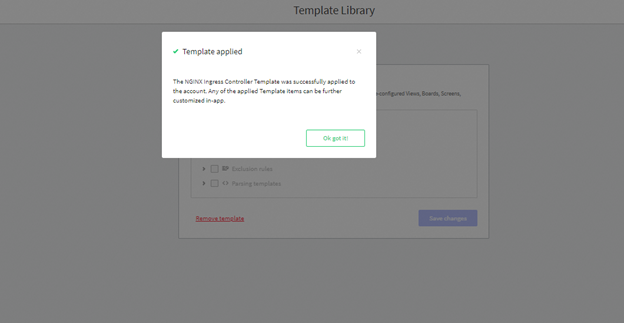
When you’ve successfully applied the template, it will look like this:

Expect a generated file with the template. Drag and drop the file where directed. After you’ve successfully applied the NGINX Ingress Controller Template, it will automatically configure views, screens, and boards to help you visualize Web traffic, latency, and response codes coming from the NGINX Ingress Controller. Using NGINX, your development team can now view logs from different sources all in one platform.

You can modify the template according to your requirements. You can add alerts or any other settings that suit your chosen logging format.
What Log Analytics are in the NGINX Ingress Controller?
There are three main components of each template: Views, Screens, and Boards, and.
The Views component of the NGINX Ingress Controller template exposes HTTP and HTTPS routes outside individual cluster services, and provides visibility into traffic and HTTP response codes, which helps with monitoring requests and upstream responses. It contains HTTP 2XX, HTTP 5XX, HTTP 404, HTTP Forbidden/Unauthorized (401, 403), and HTTP server errors, high-level Web server functionalities controlling the ingress.
The Screens component of The NGINX Ingress Controller template contains three screens for Web Analytics, Server Health, and Web Server Security.
- The Web Analytics screen provides a general live update of traffic trends for popular pages and referrers
- The Server Health screen shows a visual update of the state of applications and the upstream response of services
- The Web Server Security screen gives a live update of permission denied responses, such as the top 401 and 403 IP address errors
The Boards component of the NGINX Ingress Controller template’ includes built-in graph boards that visualize HTTP response codes and errors, traffic volume, response times, and even a specified percentile of a set of values.
All template components give instant visibility into your application logs, and are customizable to meet your needs. You can read more in the Mezmo documentation for further guidance on setting up the NGINX Ingress Controller template.

Browser Logger Template
To get trends and break down browser-side issues by the error message, OS, browser version, and more, you can use the Mezmo Browser Logger integration with the Browser Logger Template, which is compatible with the Mezmo Browser Logger's errors and logs.
Configuring the Browser Logger Template
To configure the Browser Logger Template, download it from the Mezmo template library and apply the template. You can get started with the Browser Logger Template in three easy steps:
- Sign in to your Mezmo account, then choose the template.
- Selecting a template will create a file. Drag and drop the file into the desired location.
- Check out your new views, boards, and screens in the Mezmo Web application!
- After that, you can customize the template and add alerts as needed.
What Is in the Browser Logger Template?
As with all Mezmo templates, the Browser Logger template consists of a collection of pre-configured Views, Boards, and Screens.
- The Views component shows all messages sent by the Browser Logger and all error-level logs that it captured (including uncaught exceptions)
- The Boards component offers analytics in which trends appear as subplots and board filters.
- The Screens component contains error analytics and the weekly trends of captured error messages

Windows Security Template
The Views, Boards, and Screens components of the Windows Security template provide a window into the security state of your system.
- The Views show user accounts, firewalls, system times, audit logs, and their status
- The Boards provide a visual representation of your Windows server’s activity, the number of events by channel, and failed as well as successful logins
- The Screens provide information about event logs and distribution trends, as well as the total successful and failed authentications per week.
You can quickly identify excessive login attempts, audits on cleared logs, and unusual access patterns using the Windows Security template. You can set up alerts so that you receive notifications when unexpected events occur, and you can use the dashboards to keep a constant eye on your servers' access patterns. For the Windows Security template to function properly, you must configure your NXLog to gather security event logs.
Follow these steps to set up the Windows Security Template,:
- Sign in to your Mezmo account, then choose the template.
- Selecting a template will create a file. Drag and drop the file into the desired location.
- Check out your new views, boards, and screens in the Mezmo Web application!

Mezmo Web Server Template
The Web Server Template includes detailed dashboards and graphs that make it simple to see your HTTP Web servers. It contains visibility tools that provide clear and specific HTTP Web server logs that the template analyzes and visualizes in views, screens, and boards.
- The Views tracks server errors and is customizable to alert when traffic falls below normal. It also shows HTTP server errors, including the NGINX or Apache error logs.
- The Screens focus on on monitoring Web analytics, server health, and Web server security information
- The Boards visualize the server's health, monitor HTTP response codes, and pinpoints Web traffic drop-offs or error spikes.

Heroku Template
The Heroku template can help you get started with things like app crash alerts, HTTP 500 trends, and visualizing the 95th percentile of response times, among other things. The Heroku Template utilizes Heroku platform error codes and the default router and system logs. Unlike other Mezmo templates, the Heroku template includes four components: Views, Boards, Screens, and Custom Parsing. Custom parsing is for parsing deployment hashes and initiating users into deploy_user and deploy_version.

Alternative Mezmo Template Configuration
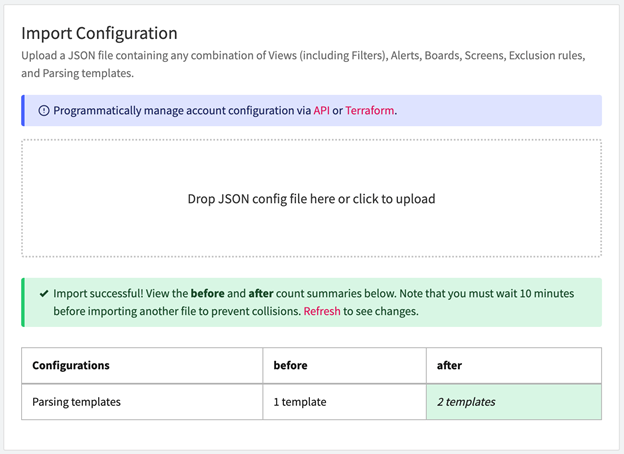
Alternatively, you can work around the installation using a prebuilt JSON file.
- Download the JSON configuration file here. This file contains the template settings.
- Navigate to Settings > Organization > Import Config.

3. When prompted to import the configuration file, drag and drop the JSON file.
4. Then, the “Import Configuration” page will appear.
5. Click “Import” and reload the page to display the updated UI.

For all of the template configurations, make sure to allow Mezmo in your ad blocker so that you will be able to see the changes. To learn more about prebuilt configurations, you can read this documentation.

Easy to Use Templates for NGINX, Heroku, and More- Just a Click Away
Mezmo's log management solution acts as a one-stop-shop for DevOps teams looking to streamline their processes through centralized application and system observability. By automating centralized log management, teams can increase productivity and better prepare to handle technological complexity. Mezmo provides several templates to customize their log management using various log agents. If you have any further questions, you can join the Mezmo community discussion forums to get answers from other users.


.svg)


