The System of Context for Production AI
AURA by Mezmo is the open-source agentic harness for the next generation of SRE. It provides the persistent orchestration and engineered context required to move AI agents from "prototype" to reliable, autonomous investigation and response in production.
How AURA works
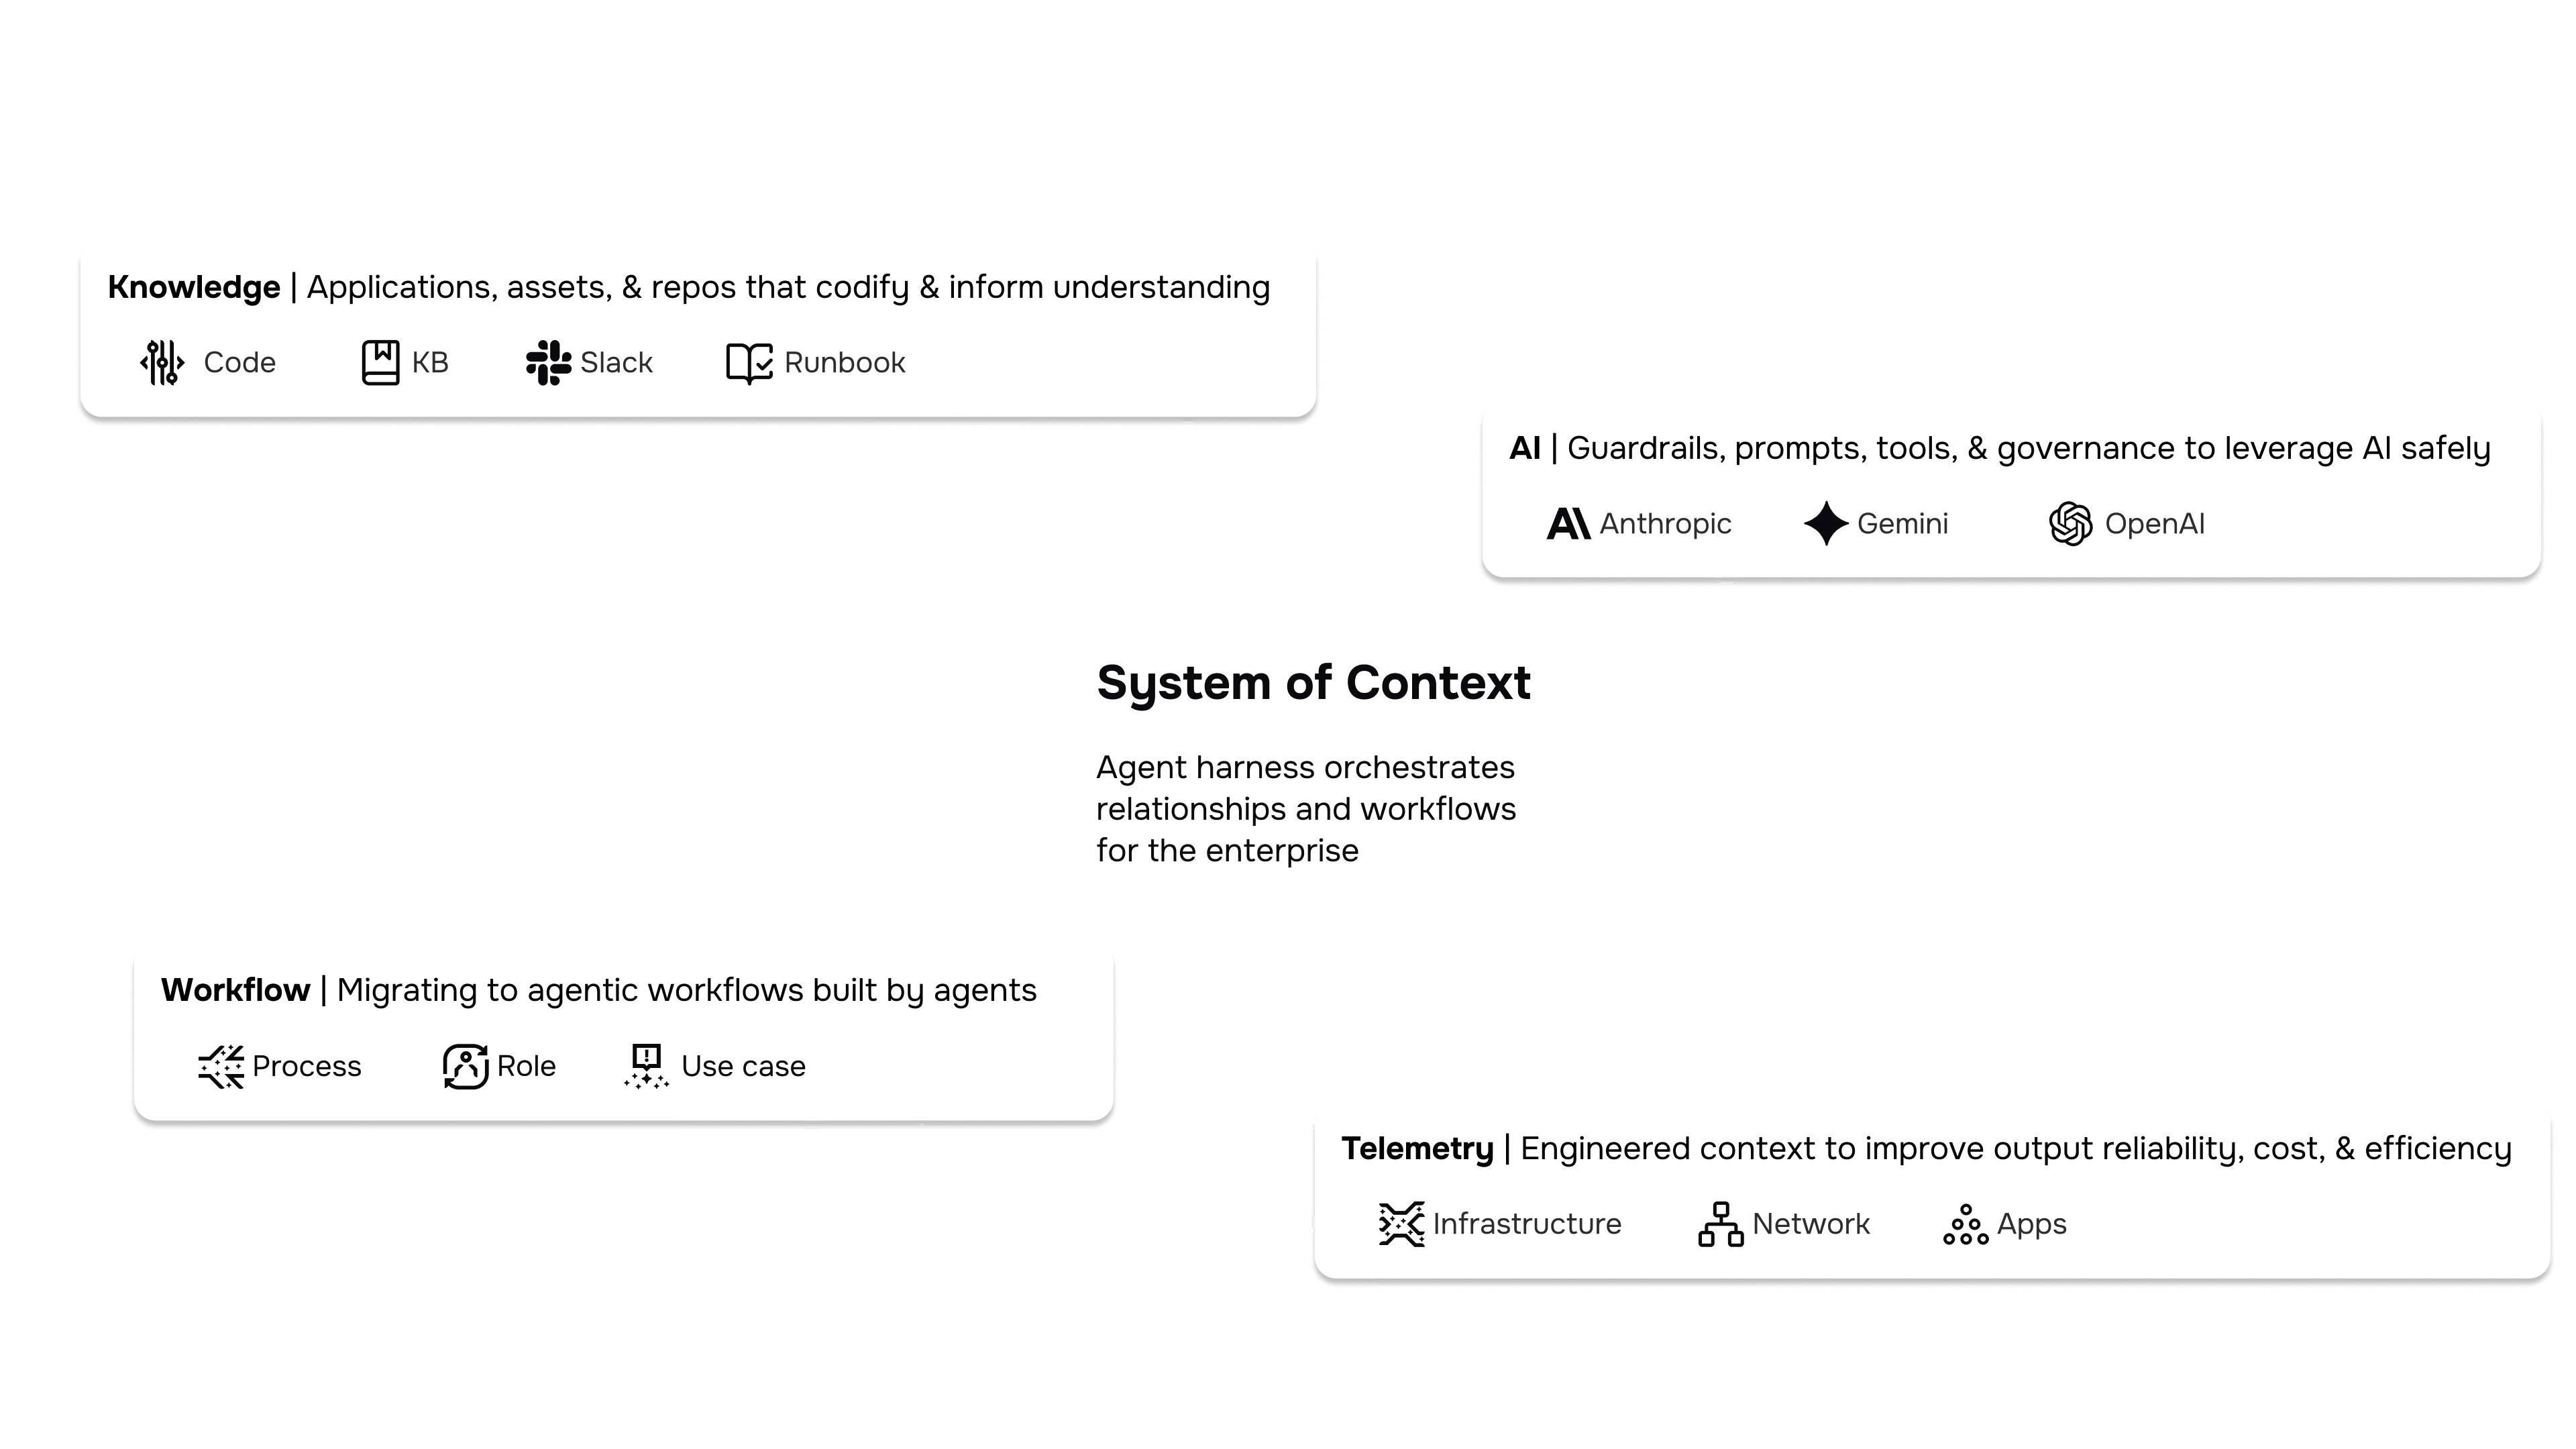
AURA works as a System of Context: an intelligent orchestration layer that assembles and propagates operational context across tools and agents within unified workflows. It coordinates multi-step tasks across your existing systems—like observability, runbooks, and ticketing—via standard MCP connections and embedded knowledge bases.
Because every step is fully inspectable and backed by a quality-driven evaluation loop, your AI's behavior is transparent and its outcomes are self-correcting. Built open and extensible by default, AURA works with your stack as it evolves.

Production-ready AI with AURA
Built for production work
Runs under real load, scales agents horizontally, and behaves predictably in live environments. Automatically optimizes for low latency by routing simple, single-worker tasks directly.
Smart orchestration and planning
AURA features an intelligent prompt router that decides when to execute directly, orchestrate, or ask for clarification. For complex work, it handles multi-stage planning, coordinates multi-agent runs, and keeps state across the workflow.
Built-in synthesis and evaluation
Powered by a strict internal loop (Plan > Execute > Synthesize > Evaluate). It seamlessly folds in context from the original prompt, the orchestrator, and individual workers, running built-in self-checks between steps to reduce noise and rework.
Extensible and transparent
Extensible via MCP
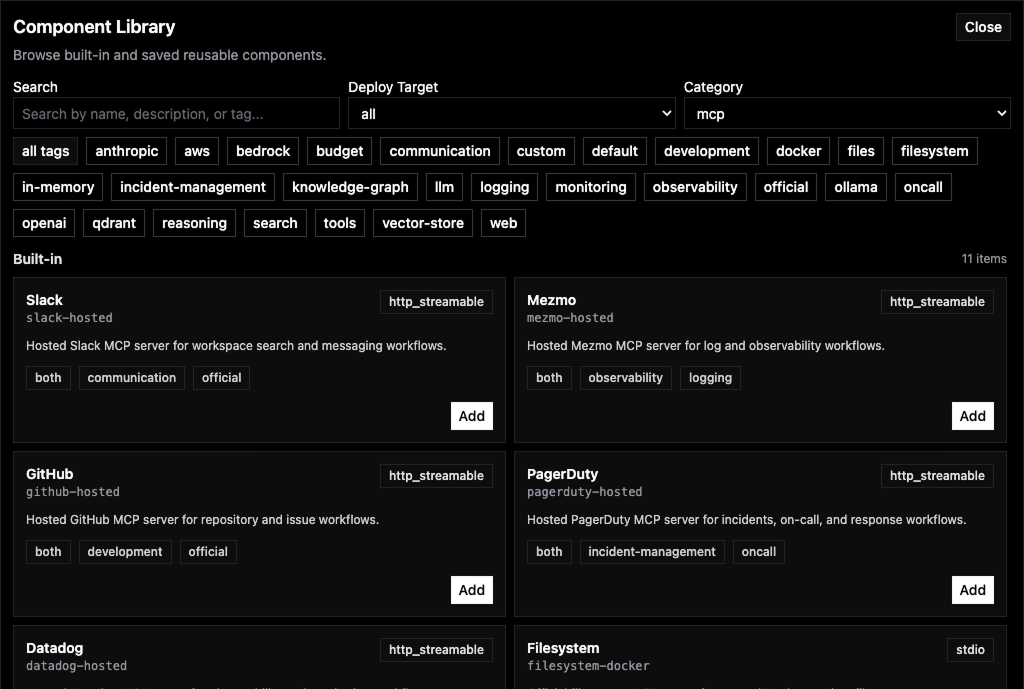
AURA uses the Model Context Protocol (MCP) to connect tools in a consistent way—so you can add new systems without rewriting your agent logic.
Custom agentic workflows
Define multi-step runbooks for your agents. AURA provides the orchestration (steps, state, retries) so workflows don't collapse the moment they get complex.
Transparent by design
Inspect, modify, and understand: see the workflow execution, the inputs/outputs, and the tool calls + context behind every decision.
Connect human + system interfaces
Bridge "human systems" (Slack/Teams) with "system interfaces" (logs/metrics/traces, ticketing, runbooks). AURA coordinates the handoffs while keeping the workflow state grounded in what's actually happening.

Why open source?
Built in the open
The context layer improves fastest when practitioners can review it, extend it, and share patterns proven in production.
Control the orchestration layer
Keep the workflow logic in your environment—inspectable and auditable—so you can adapt it to how your systems really run.
Works with your stack
Built on open standards like MCP (tool connectivity) and TOML (config), so integrations stay portable across models and tools as your stack evolves.
Production-grade foundation
A Rust service built for incident workloads, with grounding from runbooks/KBs and hooks into your existing observability.
[llm]
model = "gpt-5.2"

[agent]
name = "Multi-Worker Orchestrator"

[orchestration.worker.sre]
description = "Incident analysis worker"

[mcp.servers.mezmo]
description = "Mezmo MCP server"

[mcp.servers.datadog]
description = "Datadog MCP server"

[mcp.servers.pagerduty]
description = "PagerDuty MCP server"

[[vector_stores]]
...
